Quarantined in Stale Air? Measuring and Managing Indoor Air Quality with the Kaiterra Laser Egg+ – The Air That I Breathe Part 1
“Sometimes all I need is the air that I breathe
And to love you
All I need is the air that I breathe
Yes to love you
All I need is the air that I breathe”
Thanks to the still rampant COVID-19 / SARS-CoV-2 pandemic out there, Easter is just one of the many things in early 2020 that has moved into the safety of your home, just like marathon running, children’s education and office work.
With the time spent at home massively increased, new things start to matter. If you have kids, you likely appreciate the work of teachers and kindergarteners a whole lot more, and while smog is clearing out outside, you might be more concerned with indoor air quality than prior to the lockdown.
So, I decided to dedicate one Life-Sparring Round to indoor air quality and the setup we run in our crib. I might turn this into a little article series around the topic of air and breathing, as I am fascinated with this very elemental part of our existence. Stay tuned and subscribe to the newsletter if you want to make sure not to miss future installations.
The Never-Ending War Against Humidity
As a self-diagnosed “quantified self” nerd, I built a little smart home-setup using cheap Aqara devices. Part of the Aqara installation is a humidity and temperature sensor in our living room. Humidity is a major issue in Hong Kong, and in the wet season between April and June, keeping moisture under control is a fight over life and death of leather jackets and other items prone to molding.
We run two non-smart dehumidifiers, one for each floor in our small house. We switch both machines on for one to two hours after we take a shower to dry out the bathroom. Usually, we also run them a few hours at night, and whenever we feel the humidity is creeping up.
However, as you can see by the numbers for March, even with these aggressive measures, the humidity remains fairly high.

Humidity and Temperature in March 2020 - Exported from Kaiterra Laser Egg+ Chemical, visualized in Microsoft Power BI
We do have air split-type air conditioners with dry mode too, we run them sparsely though, more as a last resort.
Air Quality for Dummies like me
Hong Kong is a densely populated city with far too many cars, a busy airport, a massive container port, and proximity to major industrial production centers just on the other side of the Chinese border.
While air quality in Hong Kong is not as bad as in India, the Special Administrative Zone does not exactly qualify as a health resort with particularly good air either.
When you read headlines about Air Quality, usually, it references the Air Quality Index (AQI), a single value for air quality, calculated from concentrations of different pollutants.
AQI’s are calculated and published by government agencies and differ from country to country.
In the USA, the AQI is published by the US Environmental Protection Agency (EPA) and calculated from the concentrations of Ozone, Carbon Monoxide, Sulfur Dioxide, Nitrogen Dioxide, and PM2.5 and PM10 particulates. The highest measured concentration of the six measured pollutants is the current AQI, expressed in six categories from Good to Hazardous.
Ozone is more of a concern in an office environment with Laser Printers or copy machines running. Our air purifier does not have an Ionizer and should not emit Ozone.
Carbon Monoxide and Sulfur Dioxide are less of a concern as we do not cook with gas but electricity. Environmental emissions are less of a concern as we live by Hong Kong standards in the countryside. Living on the south side of Lantau Island, we are shielded from the Airport and air traffic emissions by the glorious Lantau Peak (934 meters).
This leaves as primary concerns for indoor air quality particulate matter (PM 2.5 / PM 10), which can be from outside (smog), pollen, or from indoor sources like dust, oil smoke, or mold spores.
Another concern for indoor pollution is TVOC (total volatile organic components). TVOCs are organic chemicals that are gaseous at low temperatures. The list of different TVOCs is long, but Formaldehyde (a strong irritant) and Benzene (a carcinogenic chemical) are prominent members of the group.
TVOCs can be emitted from furniture, home textiles, cleaning products, cooking processes or cosmetics. That wide range of potential sources makes it very difficult to control.
You can only manage what you measure – Introducing the Laser Egg
Sensitized by more and more studies pointing at the negative impact of low air quality on healthspan, I did some research and invested in some gear when I moved into my first own property end of 2018.
After comparing a range of different air quality sensor, I bought a Kaiterra Laser Egg+ Chemical (previously called Laser Egg 2).
The Laser Egg was not exactly cheap, but at US$ 199 (you get a 10% discount if you sign up for their newsletter or you can get it on Amazon (Affiliate Link)), Kaiterra’s sensor offered not only PM 2.5 and PM 10 particle measurement but also TVOC date. Additional arguments were a decent form factor, Apple HomeKit compatibility, a decent app, and a website that offered a bit more credibility than the usual Kickstarter offering.

With the company mission, “We exist so that one day we don’t have to,” Kaiterra is the ultimate purpose-driven company.
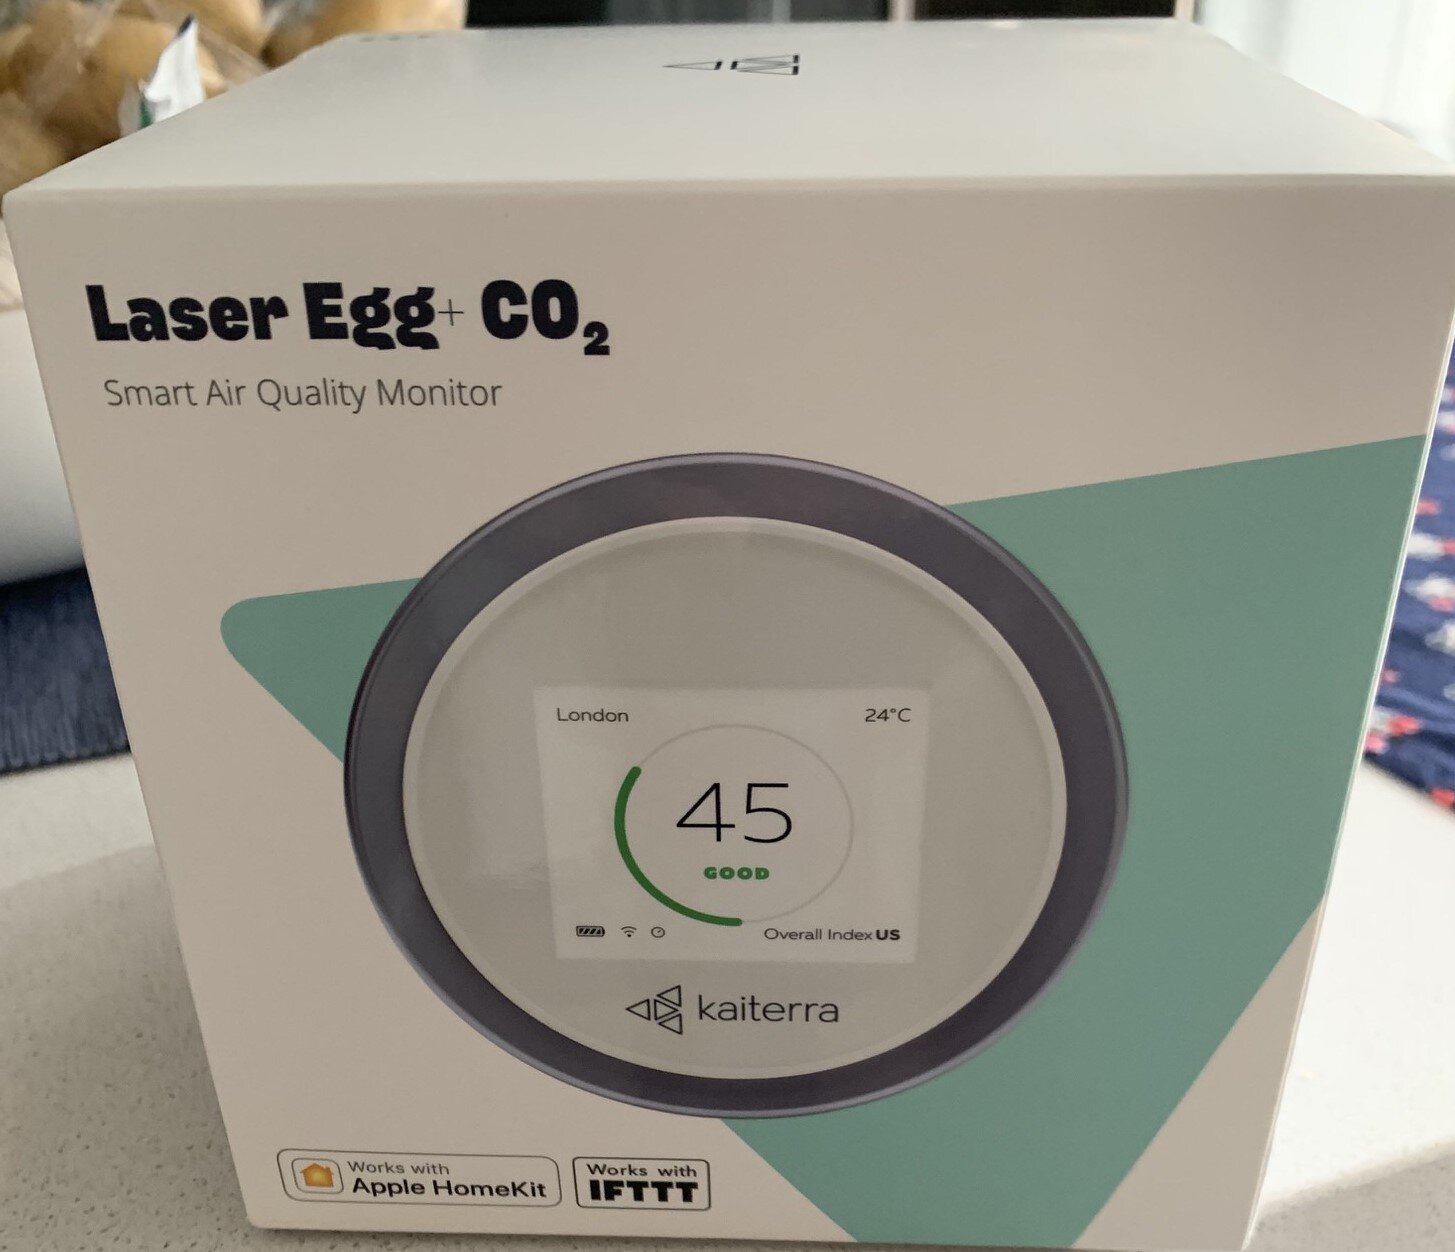
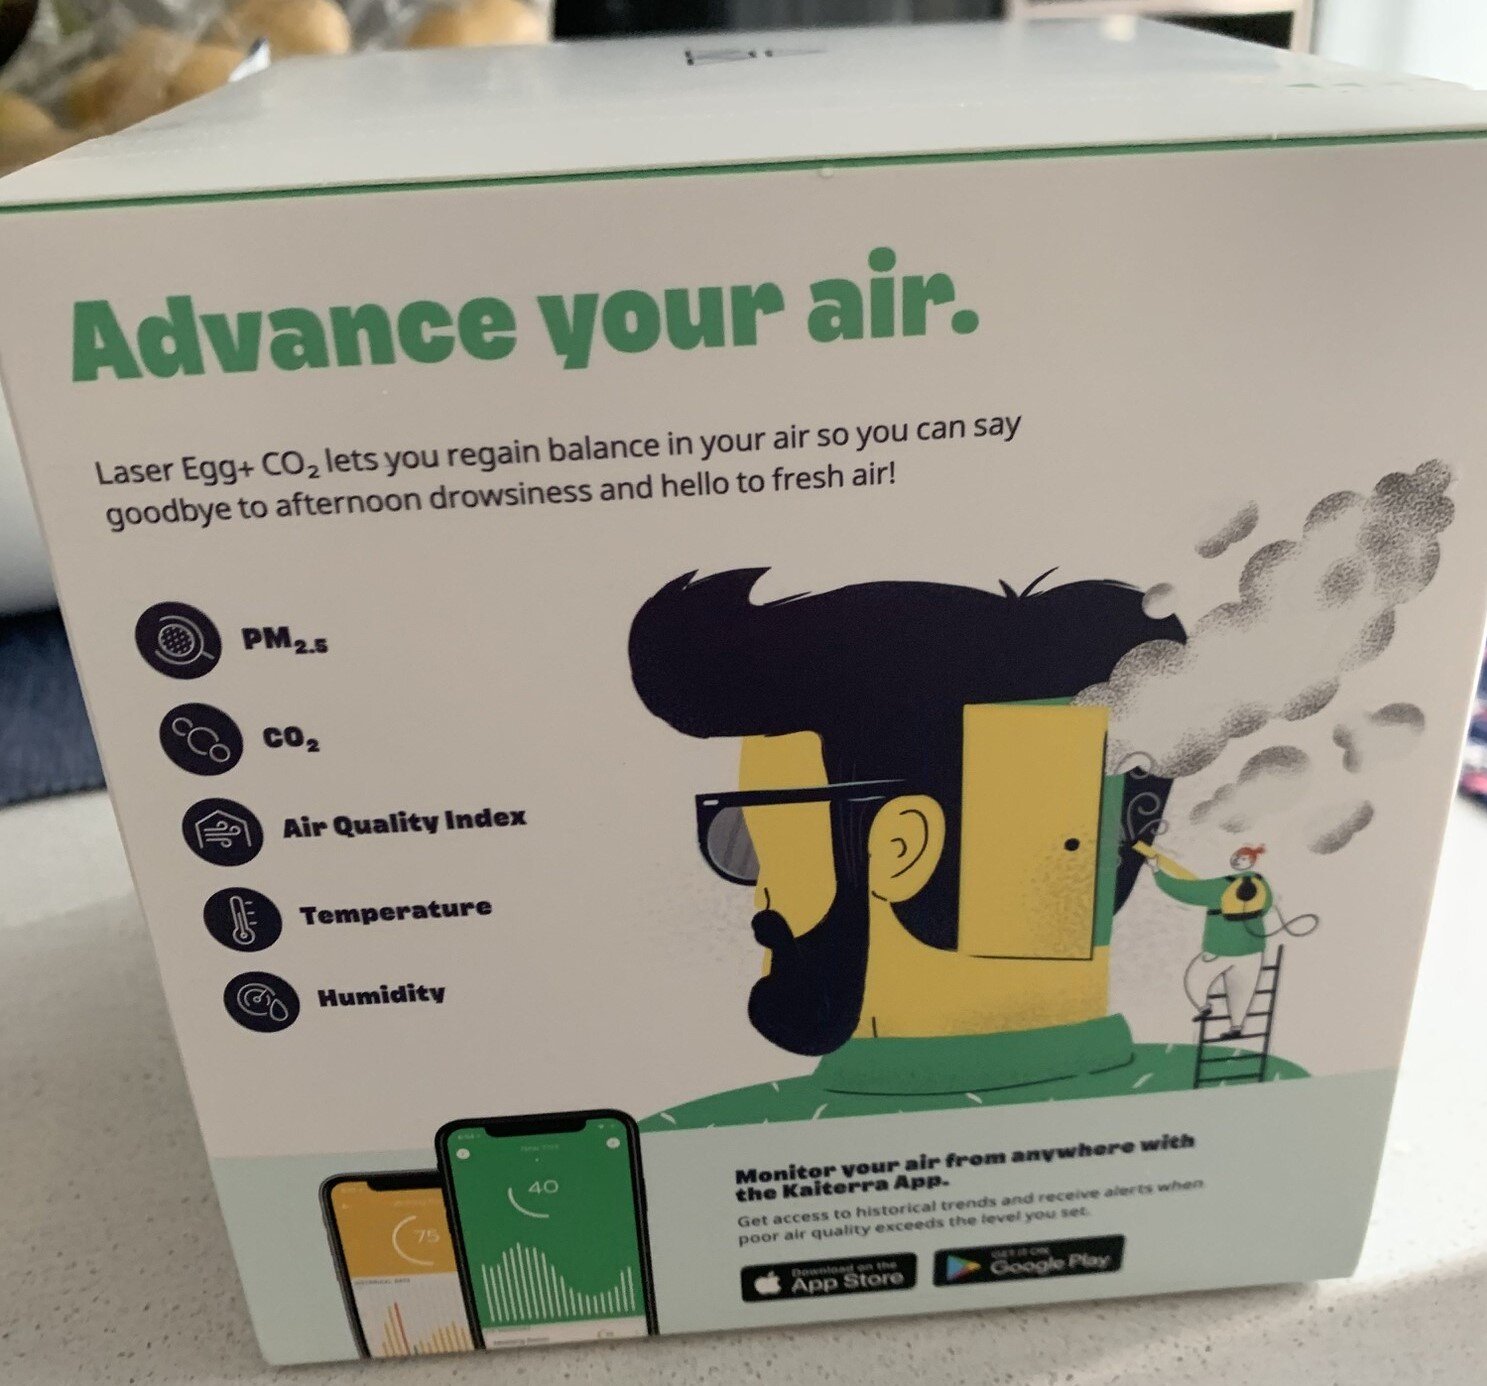
After buying my first Laser Egg+ Chemical in 2018, I participated in a questionnaire in 2019 when Kaiterra launched the Laser Egg+ CO2 and won a free unit. The laser Egg+ CO2 is identical with the Laser Egg+ Chemical, but instead of measuring TVOCs with a metal oxide semiconductor, it measures the Carbon Dioxide concentration in the air.
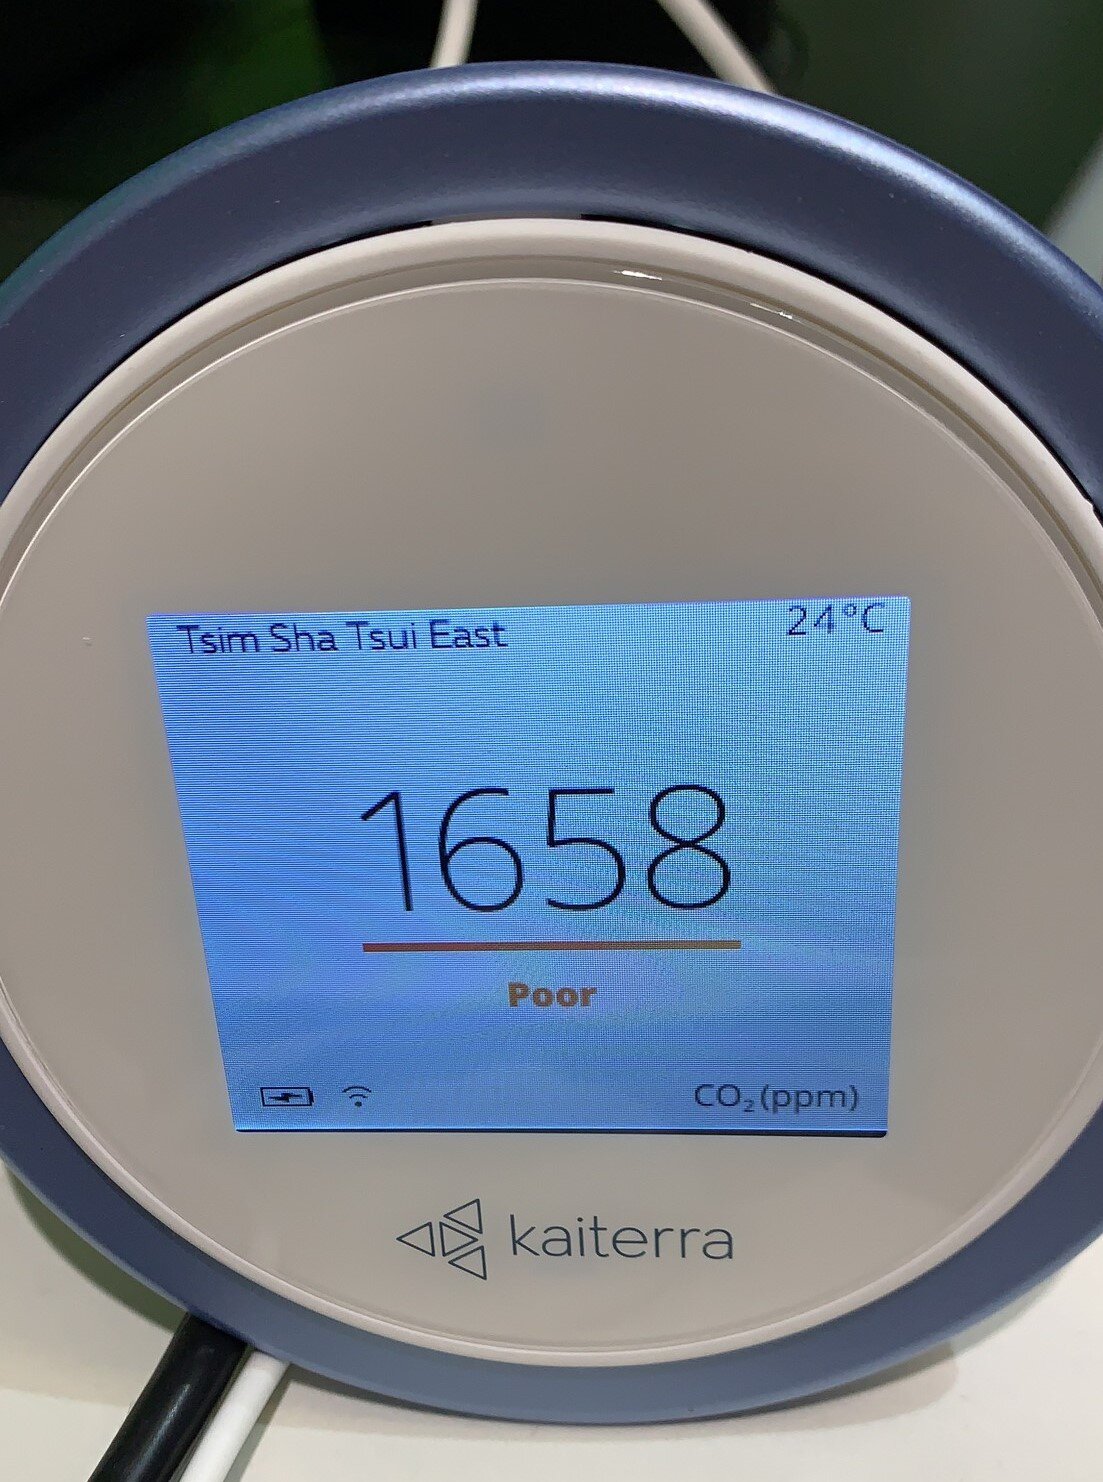
While my Laser Egg Chemical sits on the desk in my study at home, the Laser Egg CO2 (Amazon Affiliate Link) was, for the most time, placed on my office desk at work. Only recently, I brought it home and have it measuring the air quality in our kitchen, which is on the same floor as my study.
The Laser Egg comes nicely packed in a cube-shaped box and installed like other smart devices via mobile app and WIFi-access. The Laser Eggs are Apple Home Kit compatible, so they show a home kit QR code upon holding the navigation button.
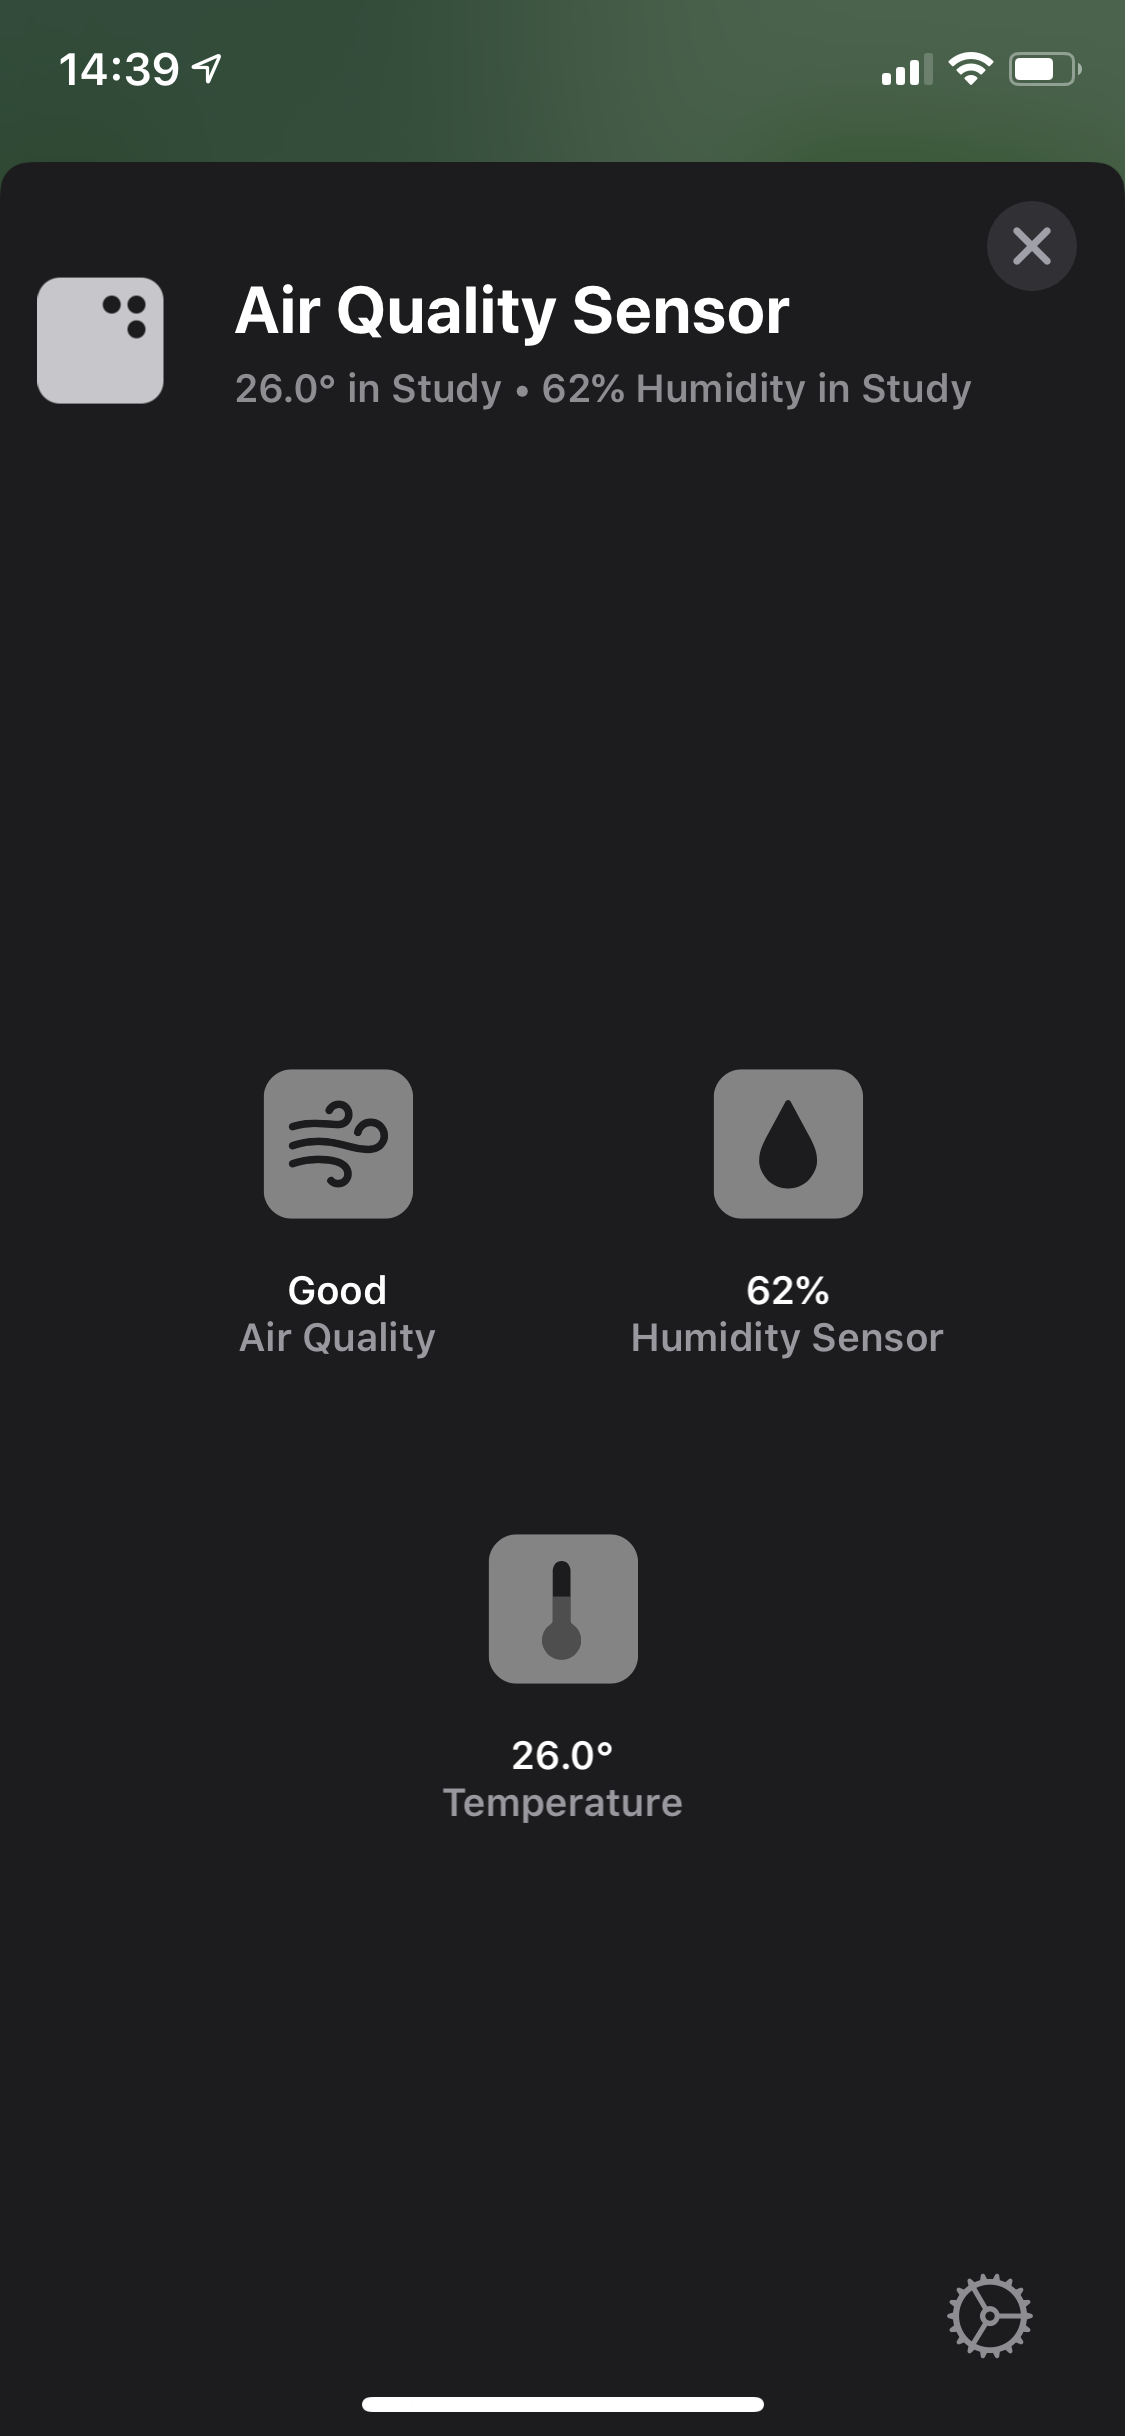
All measurements of the Laser Egg are displayed on the display of the device and are broadcasted to the Kaiterra App, Apple HomeKit (air quality is just shown as a summary value in HomeKit), and third-party apps like Air Matters. Kaiterra’s devices also can be connected to other services via IFTTT to create some automated routines.
A massive plus for Kaiterra is that they allow you to download all data captured by your device as a CSV file. You simply specify the data range, and you receive a download link per email, with one value per minute for all data captured by the sensor. As Microsoft Excel can only visualize a time axis with daily values, I used the free version of Microsoft Power BI to create graphs from the Laser Egg data.
A lot of manufacturers do not provide raw data. They probably lack confidence in the quality of their sensors or believe in the necessity to protect their proprietary algorithms. For me providing an option to download the raw data from a device that I purchased is a vital factor when choosing an app or device. Kaiterra stays consistent with their purpose-driven business model, and I believe that their goal is not maximizing the amount of money by scaring people into buying more of their devices but promoting the awareness for air quality.
Voodoo magic or Science?
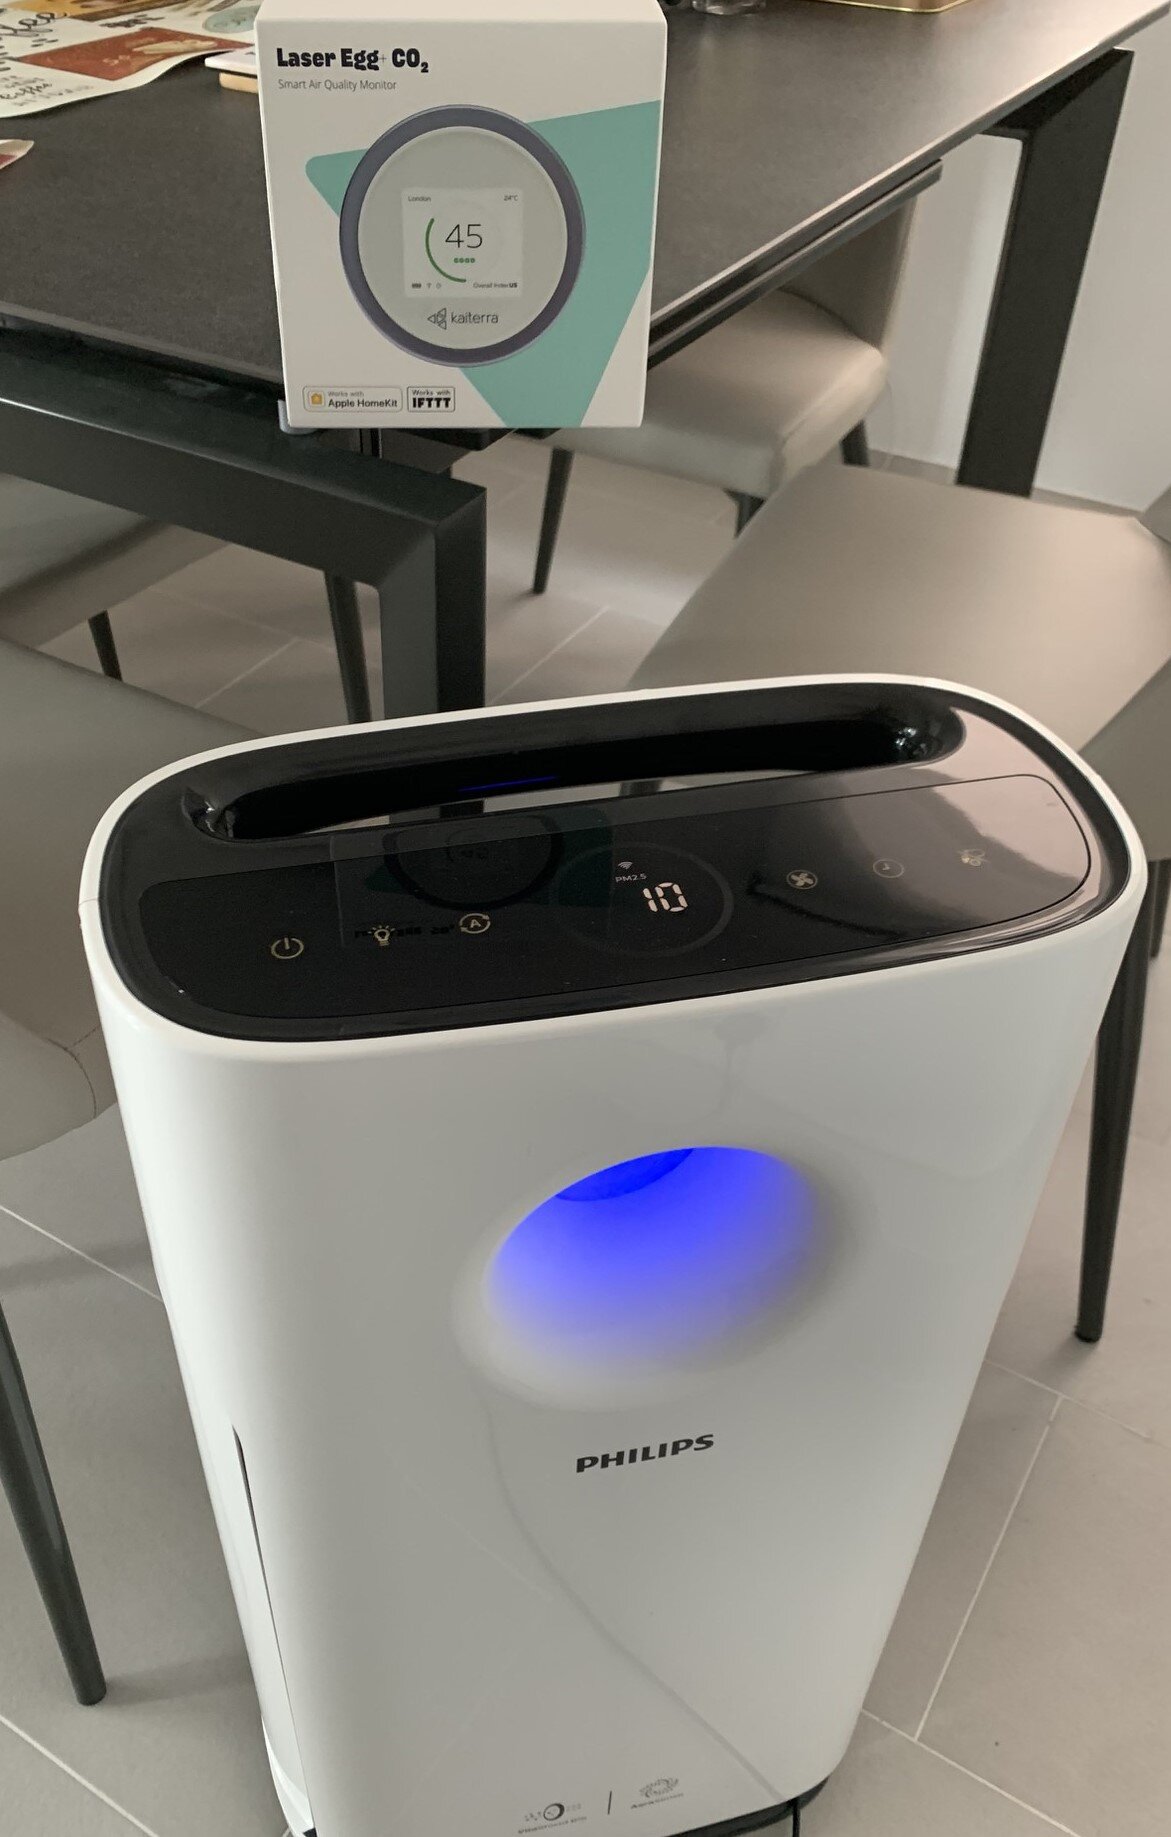
When I decided to control indoor air quality in our new home, I did not just buy my first Laser Egg, but also a pretty large Philips AC3259 Wi-Fi-connected air purifier.
Recommended for a room size of 28-48 square meters (300 - 527 square feet), the Philips is quite powerful for our 800 square feet home.
In all honesty, I was skeptical about the quality of all environmental sensors and air purifiers. I somewhat expected that the accuracy of measurements was not that exact and, at best, could show trends in air quality and had my doubts concerning the effectiveness of air purifiers.
I have neither the ability nor the equipment to run my hardware to a scientific lab test. I leave this to the specialists. However, monitoring the measurements for more than a year, I have to say that the Laser Eggs seem to perform quite accurately, and the purifier does affect the numbers quite significantly.
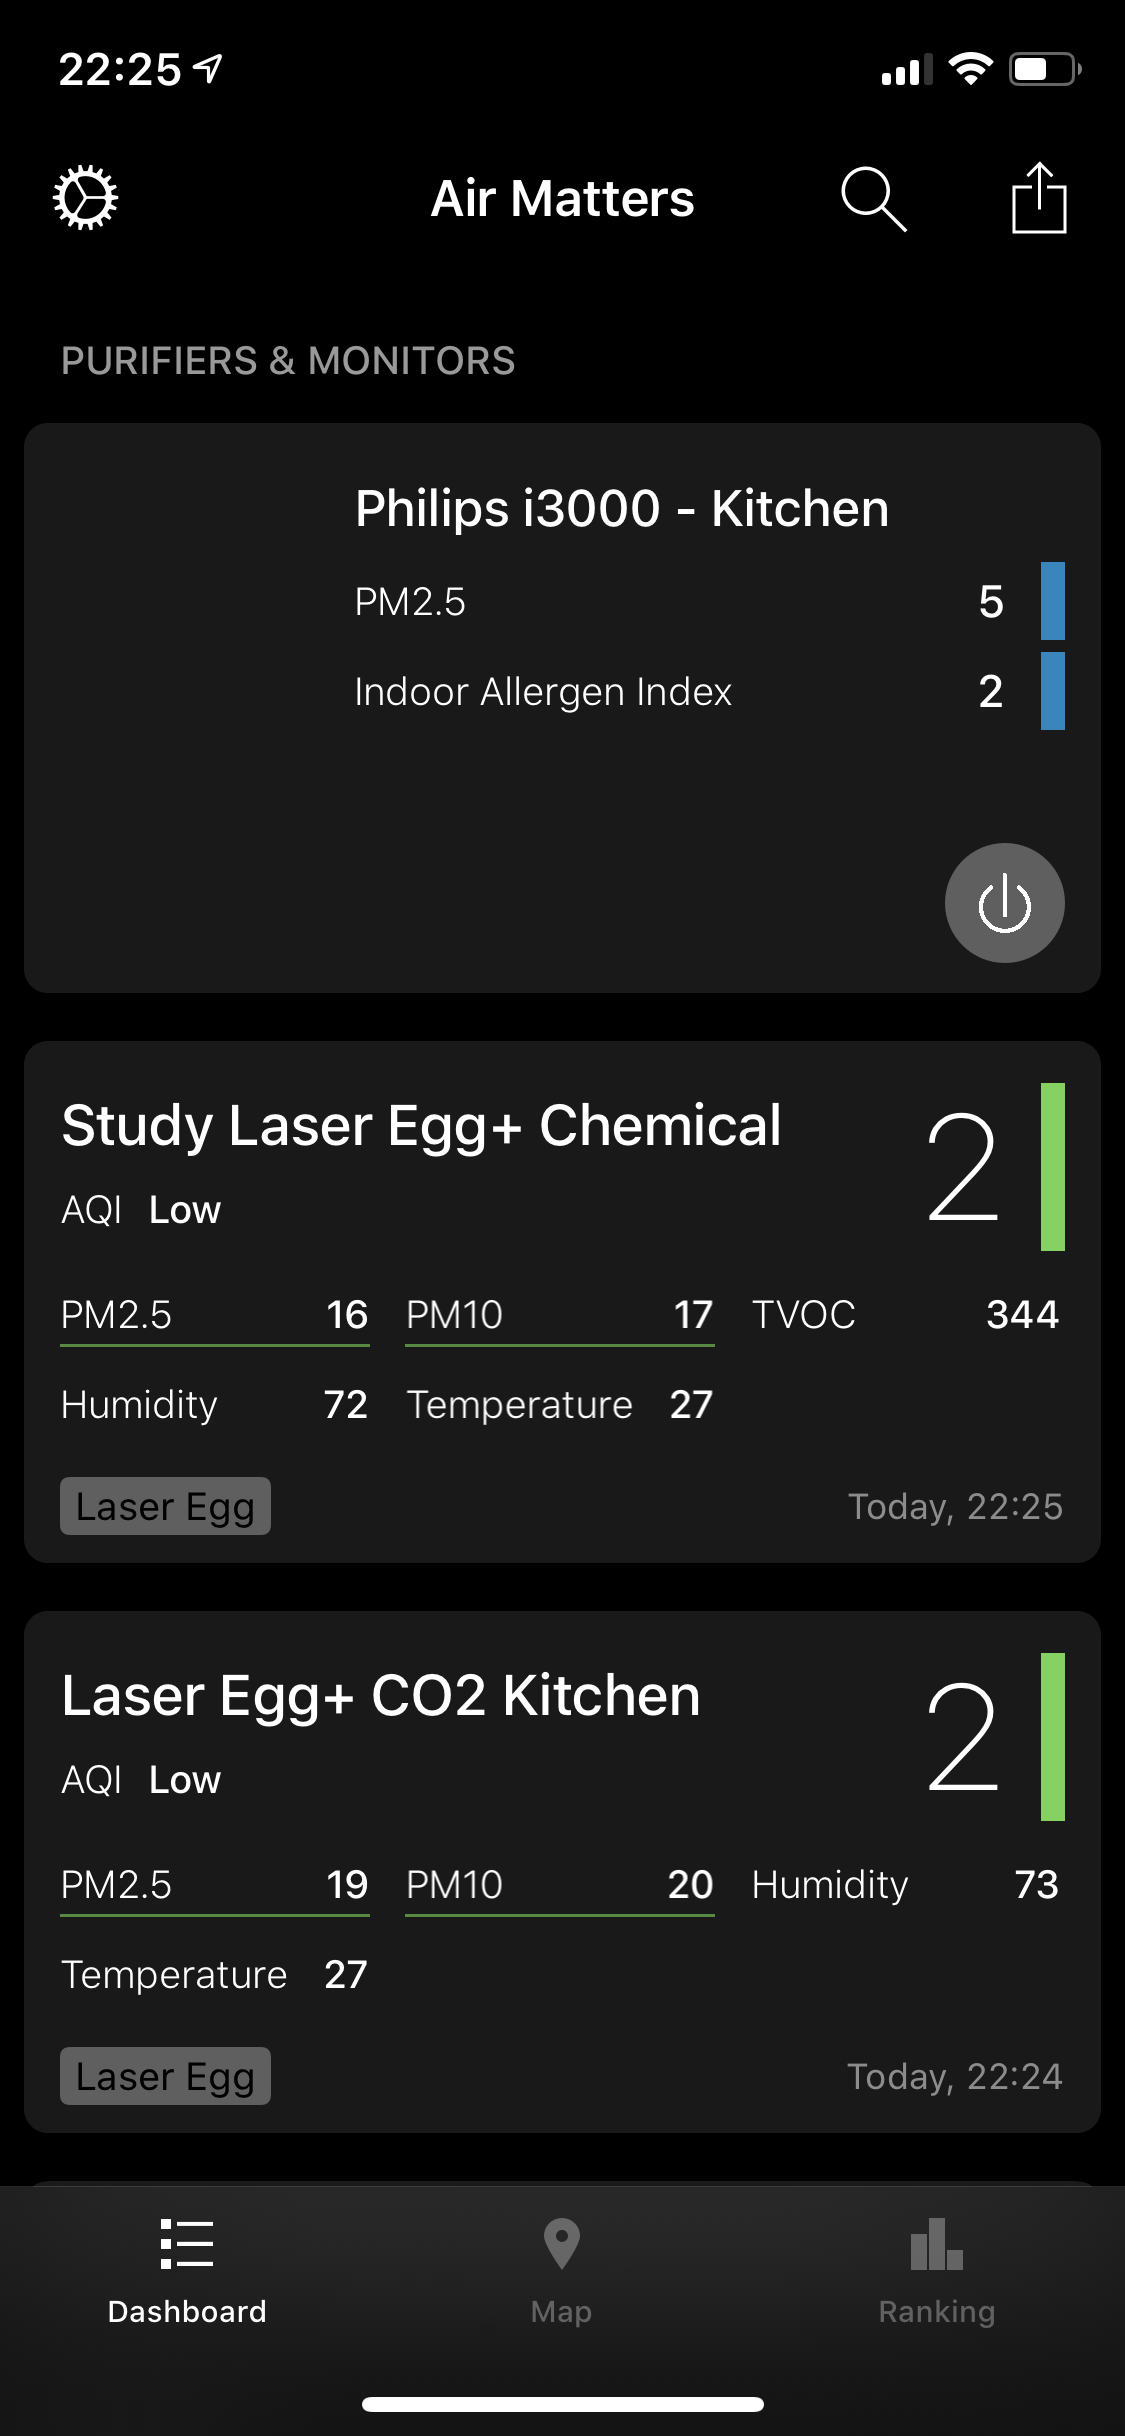
Now that I do have two Laser Eggs in the same household, I can compare both PM 2.5 values, and they generally align spot on.
In general, the PM 2.5 values between the Laser Eggs and the Philips air purifier are pretty close almost all the time. Philips does not have a proprietary app but endorses popular third-party air quality app Air Matters for their connected air purifiers. As Kaiterra also supports Air Matters, the app is the perfect dashboard to visualize environmental data and data from both Laser Eggs and the Philips. From the same Wi-Fi-Network, the purifier can also be controlled via the mobile app.
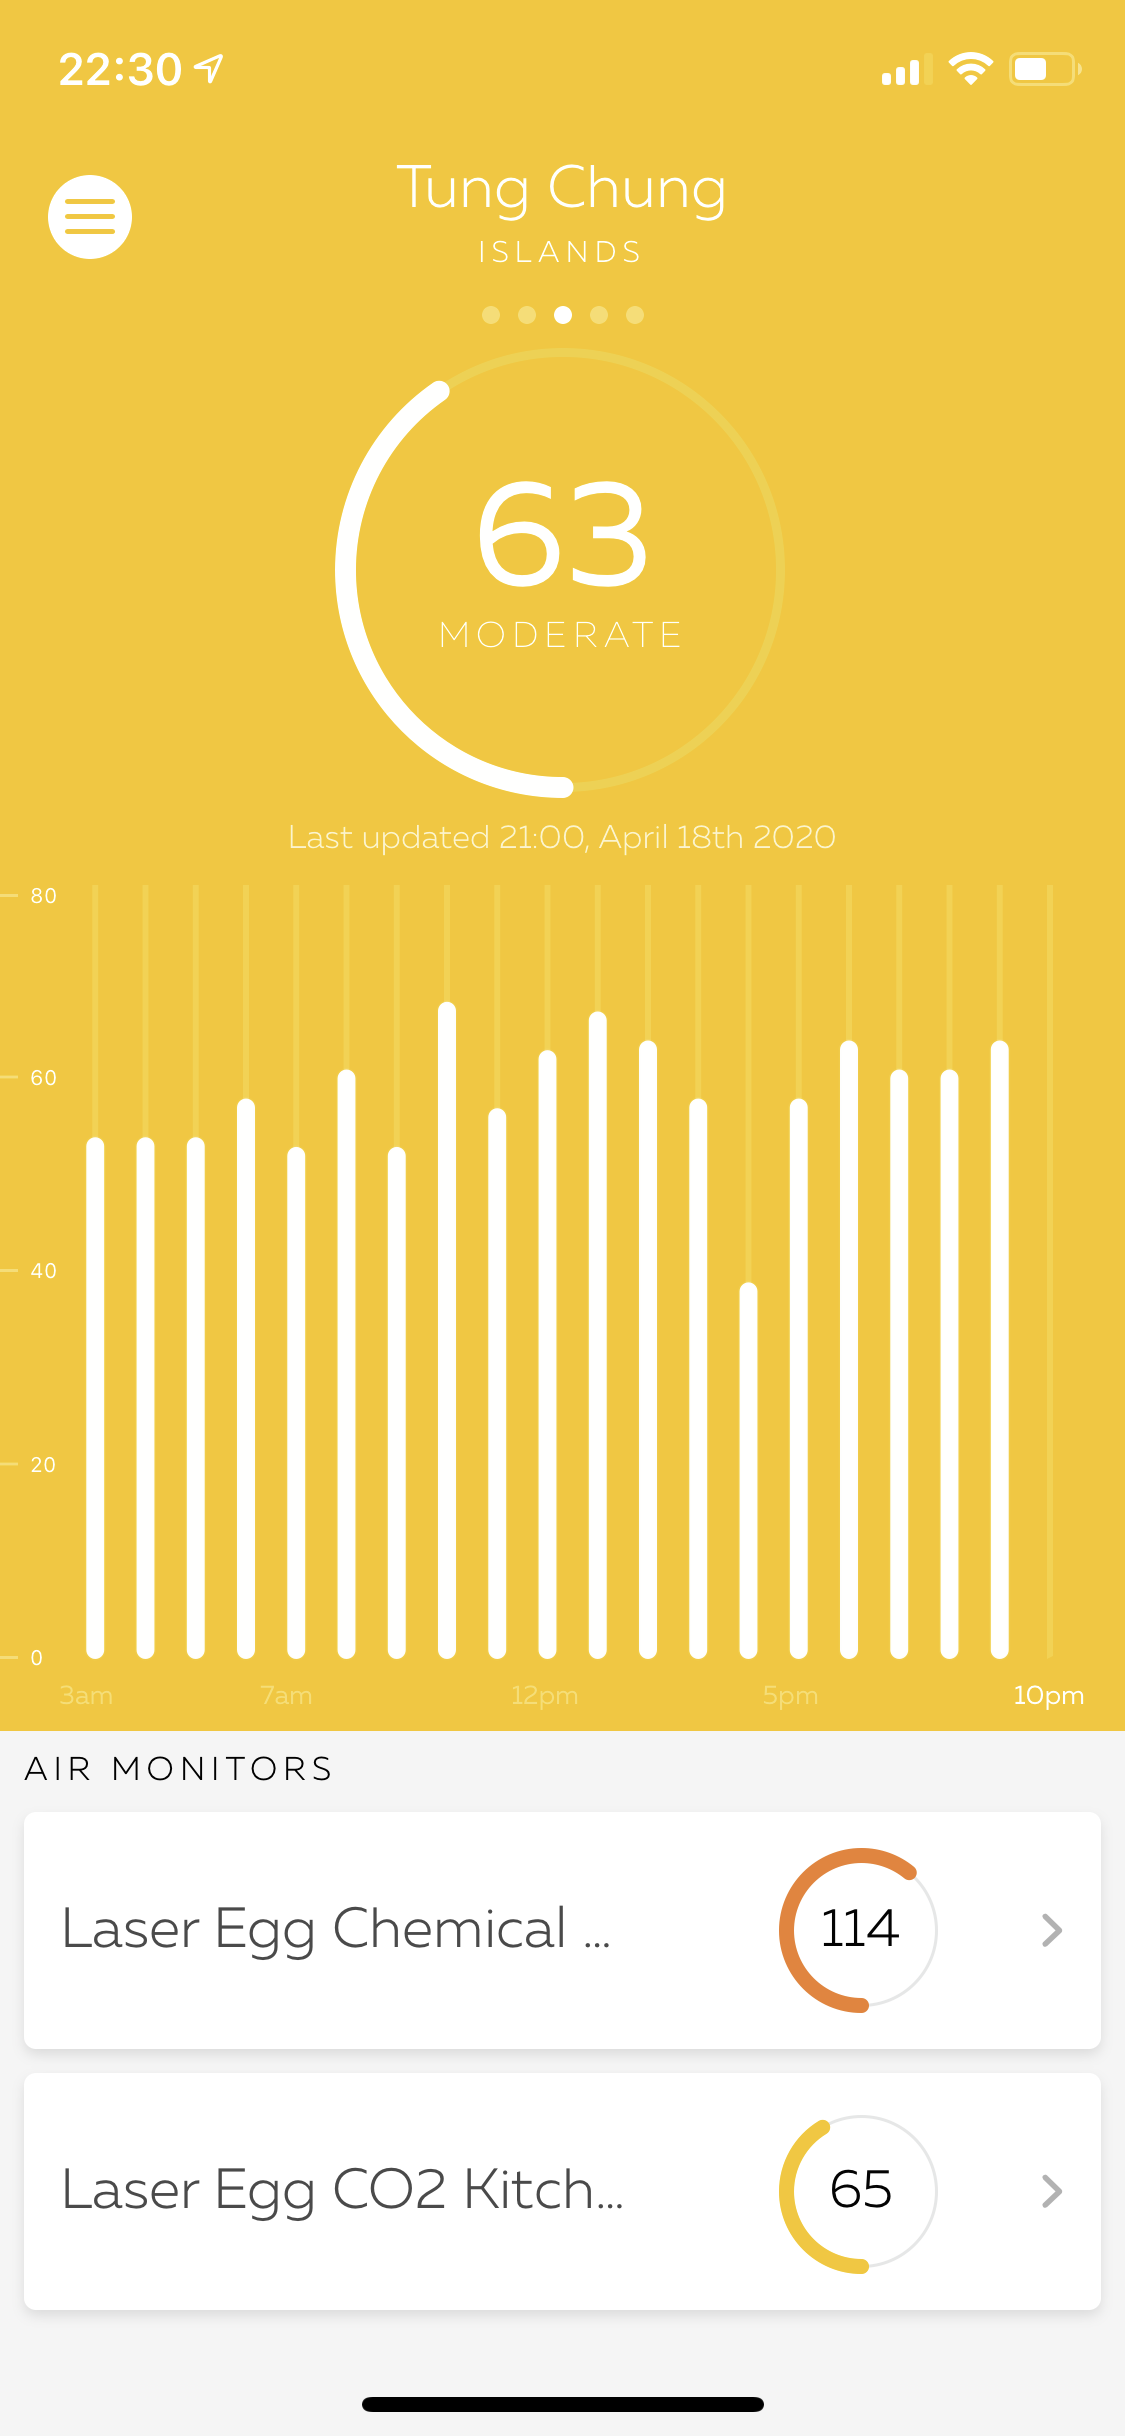
Overall, all measurements tie in quite well with activities in and around the house.
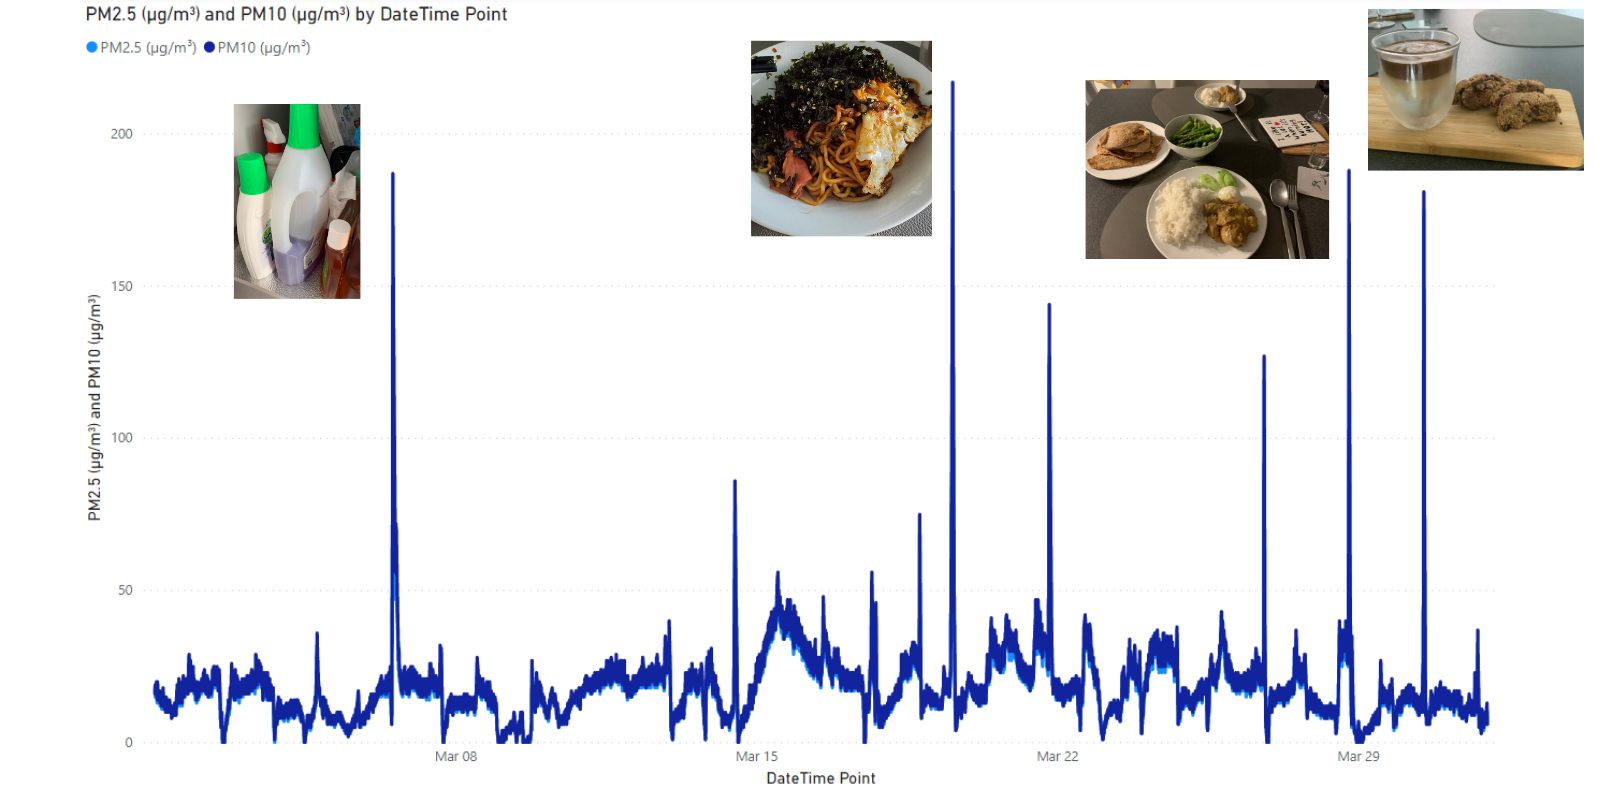
Detective work and a month of particulate matter data. Measured with the Kaiterra Laser Egg+ Chemical, visualized in Microsoft Power BI.
On hazy days, you see higher values indoor mirroring the trends of the environment, values of both PM 2.5 and TVOC spike to extremes when my wife is baking, frying or cleaning. Her panfried Indian Nan bread, self-made brunch Biscotti are just two examples that explain spiking pollutant values.
At the same time, you see the curve coming back quickly after some ventilation and running the air purifier. Usually, we are getting the values back to normal levels within half an hour of their occurrence.
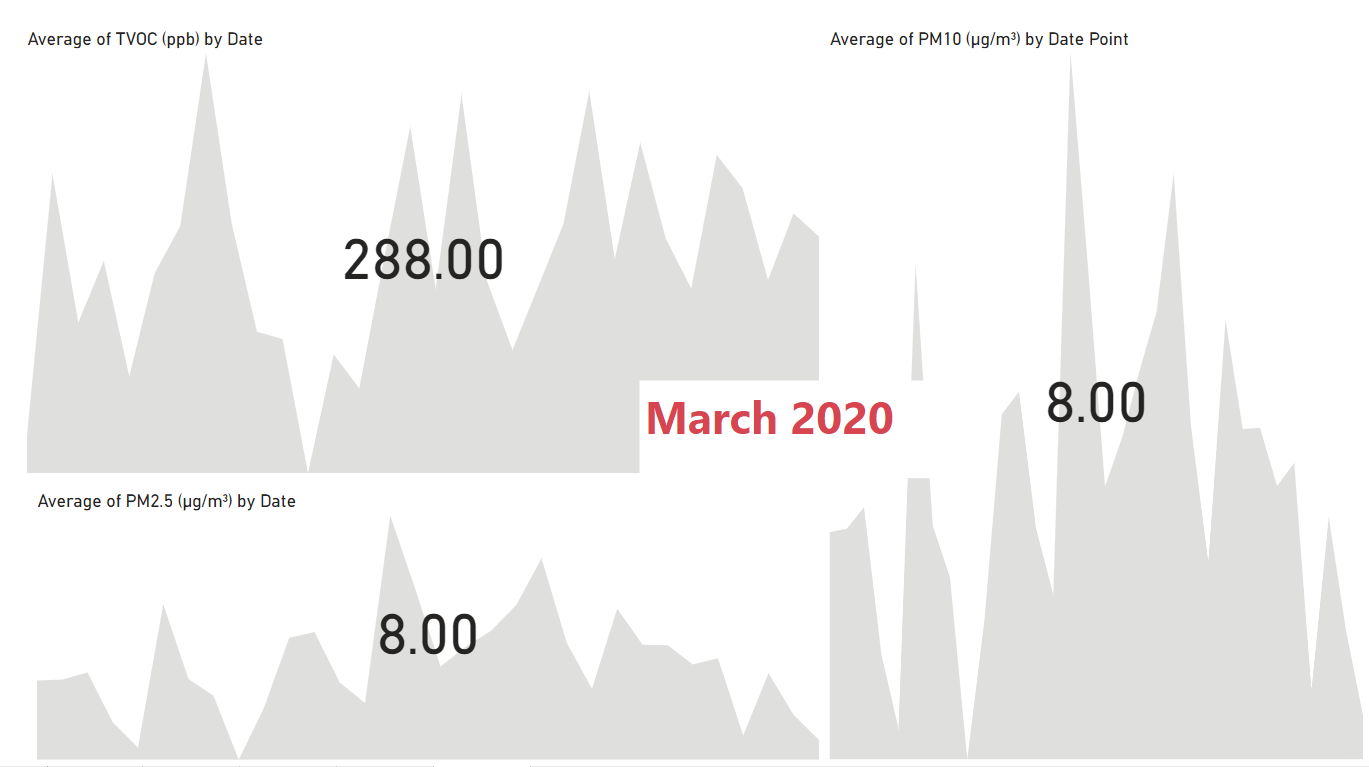
Monthly Averages March 2020 - Measured with the Kaiterra Laser Egg, visualized in Power BI.
The monthly averages for TVOC and PM 2.5 do not look too bad.
PM 2.5 and PM 10 stayed at 8 micrograms per cubic meter, way below the value of 12 that is considered safe by the US Environmental Protection Agency.
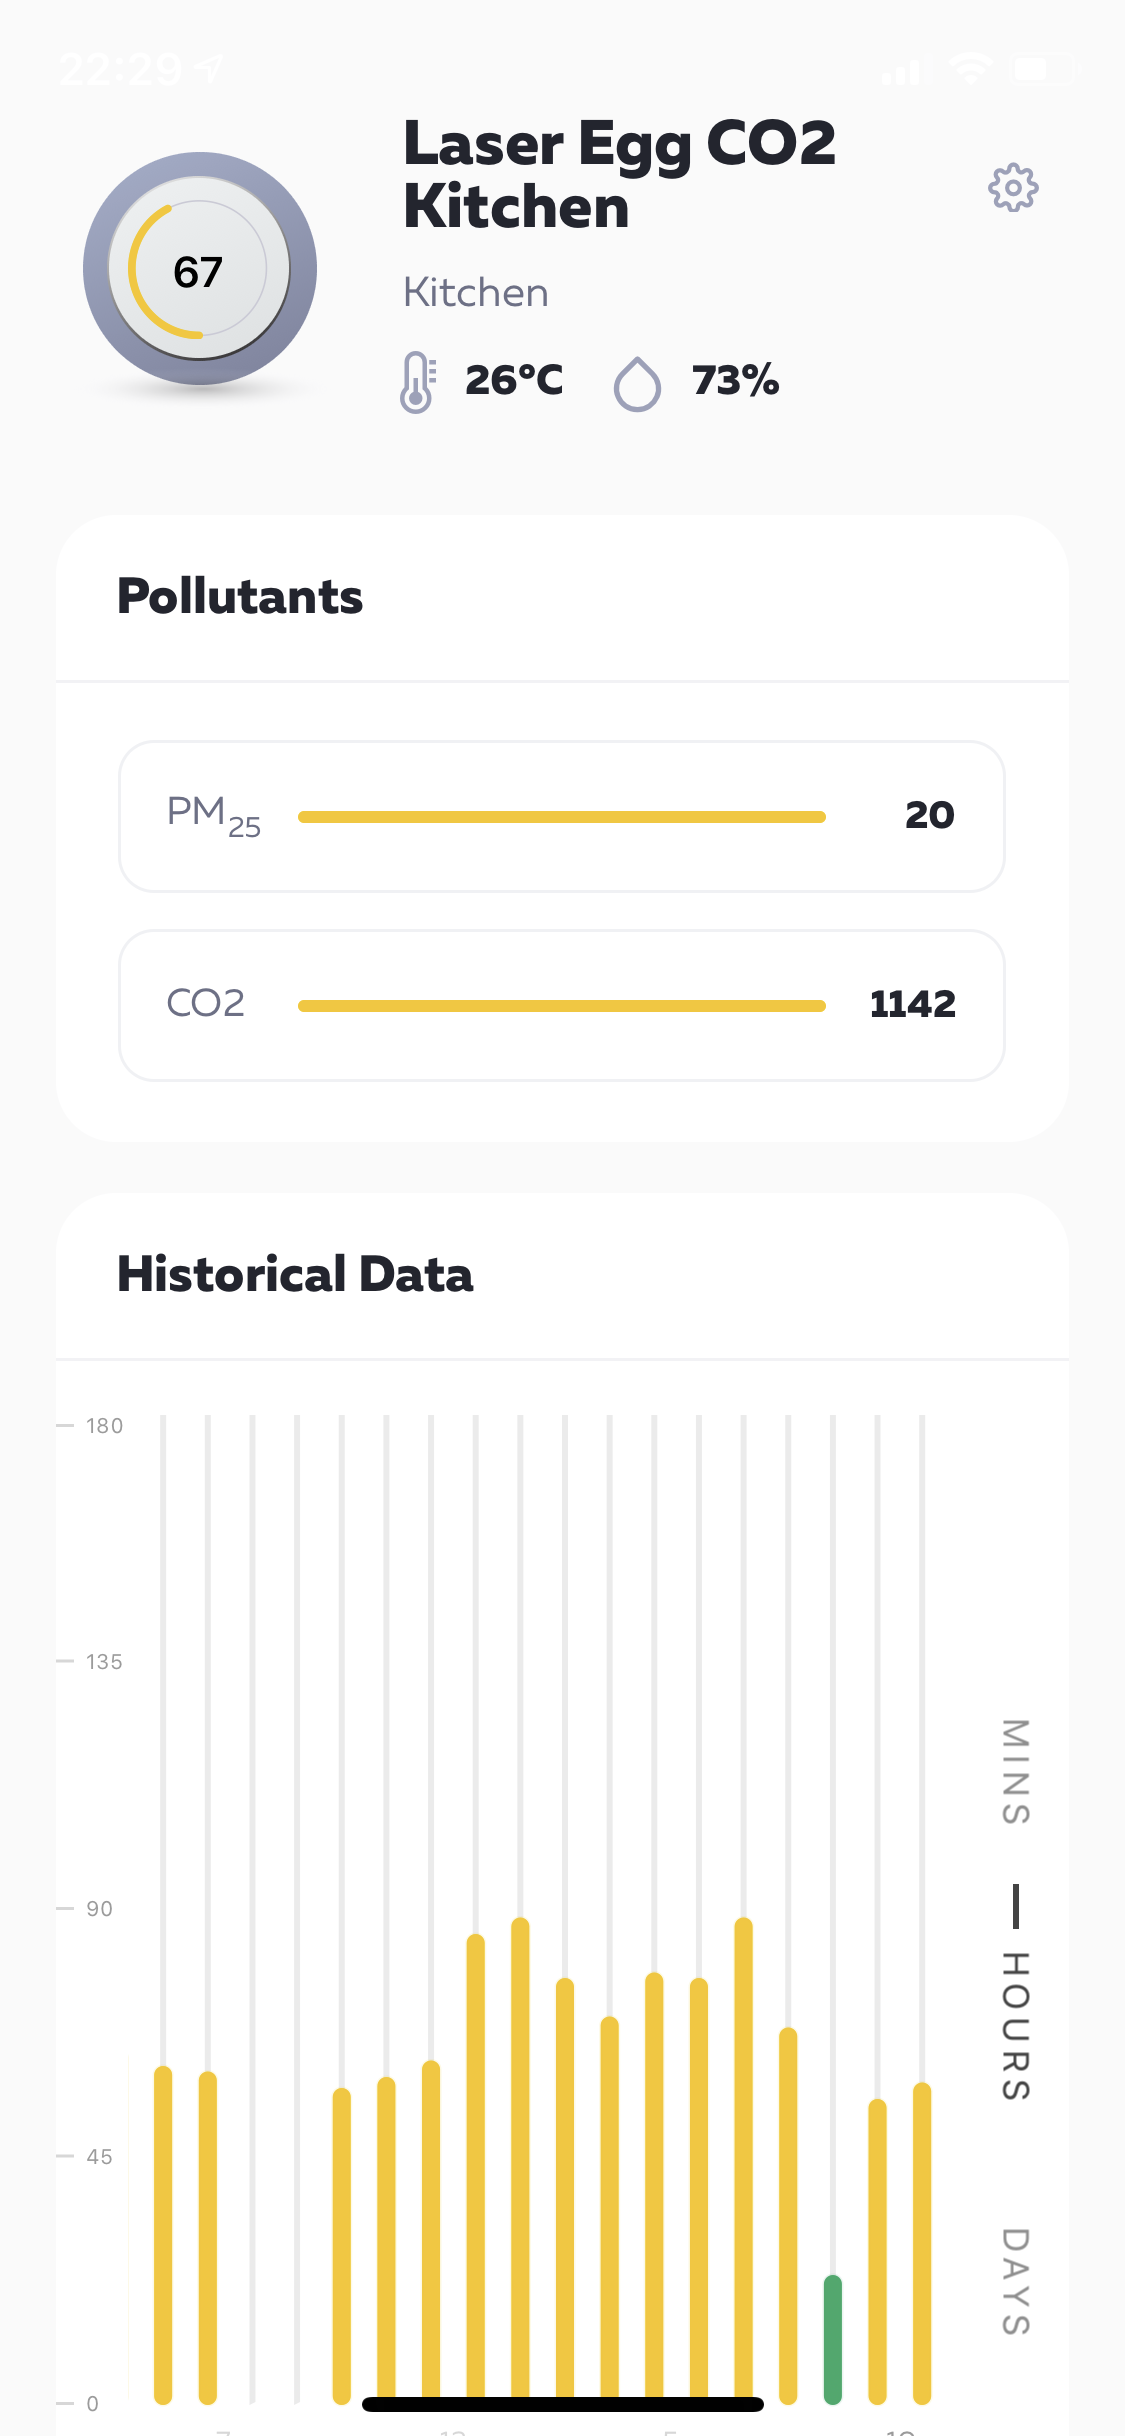
TVOC at 288 parts per billion is relatively high throughout the month and definitely something to look at. Here the base value was generally higher, while the spikes were also largely aligned with the cooking, baking and cleaning activities. This is something that I definitely want to do more research on. I also have not played too much around with the CO2 data from the second Laser Egg. During the time the sensor was at the office and sharing a small glass cubicle with one of my staff, we apparently filed our little fish tank by lunchtime with Carbon Dioxide.
Have you done any experiments on indoor air quality? If yes, I would be very interested in your numbers.
If you want to geek out completely, I recommend the 484 pages long WHO Guidelines For Indoor Air Quality or the 2014 study “Odor and VOC Emissions from Pan Frying of Mackerel at Three Stages: Raw, Well-Done, and Charred” a massive study measuring TVOCs released frying fish. Most national environmental protection agencies also have quite detailed resources on air quality online. There is an abundance of information available.